
Element FolioElement FolioAdvanced Materials IntelligencePSEMIC ERP ↗
MODULE 02

Materials Characterization Techniques

5 subjects · structured reading from the supplied course material

SUBJECT 01 / 05

Microscopy Techniques

TOPIC

Principles of optical microscopy

Principles of optical microscopy

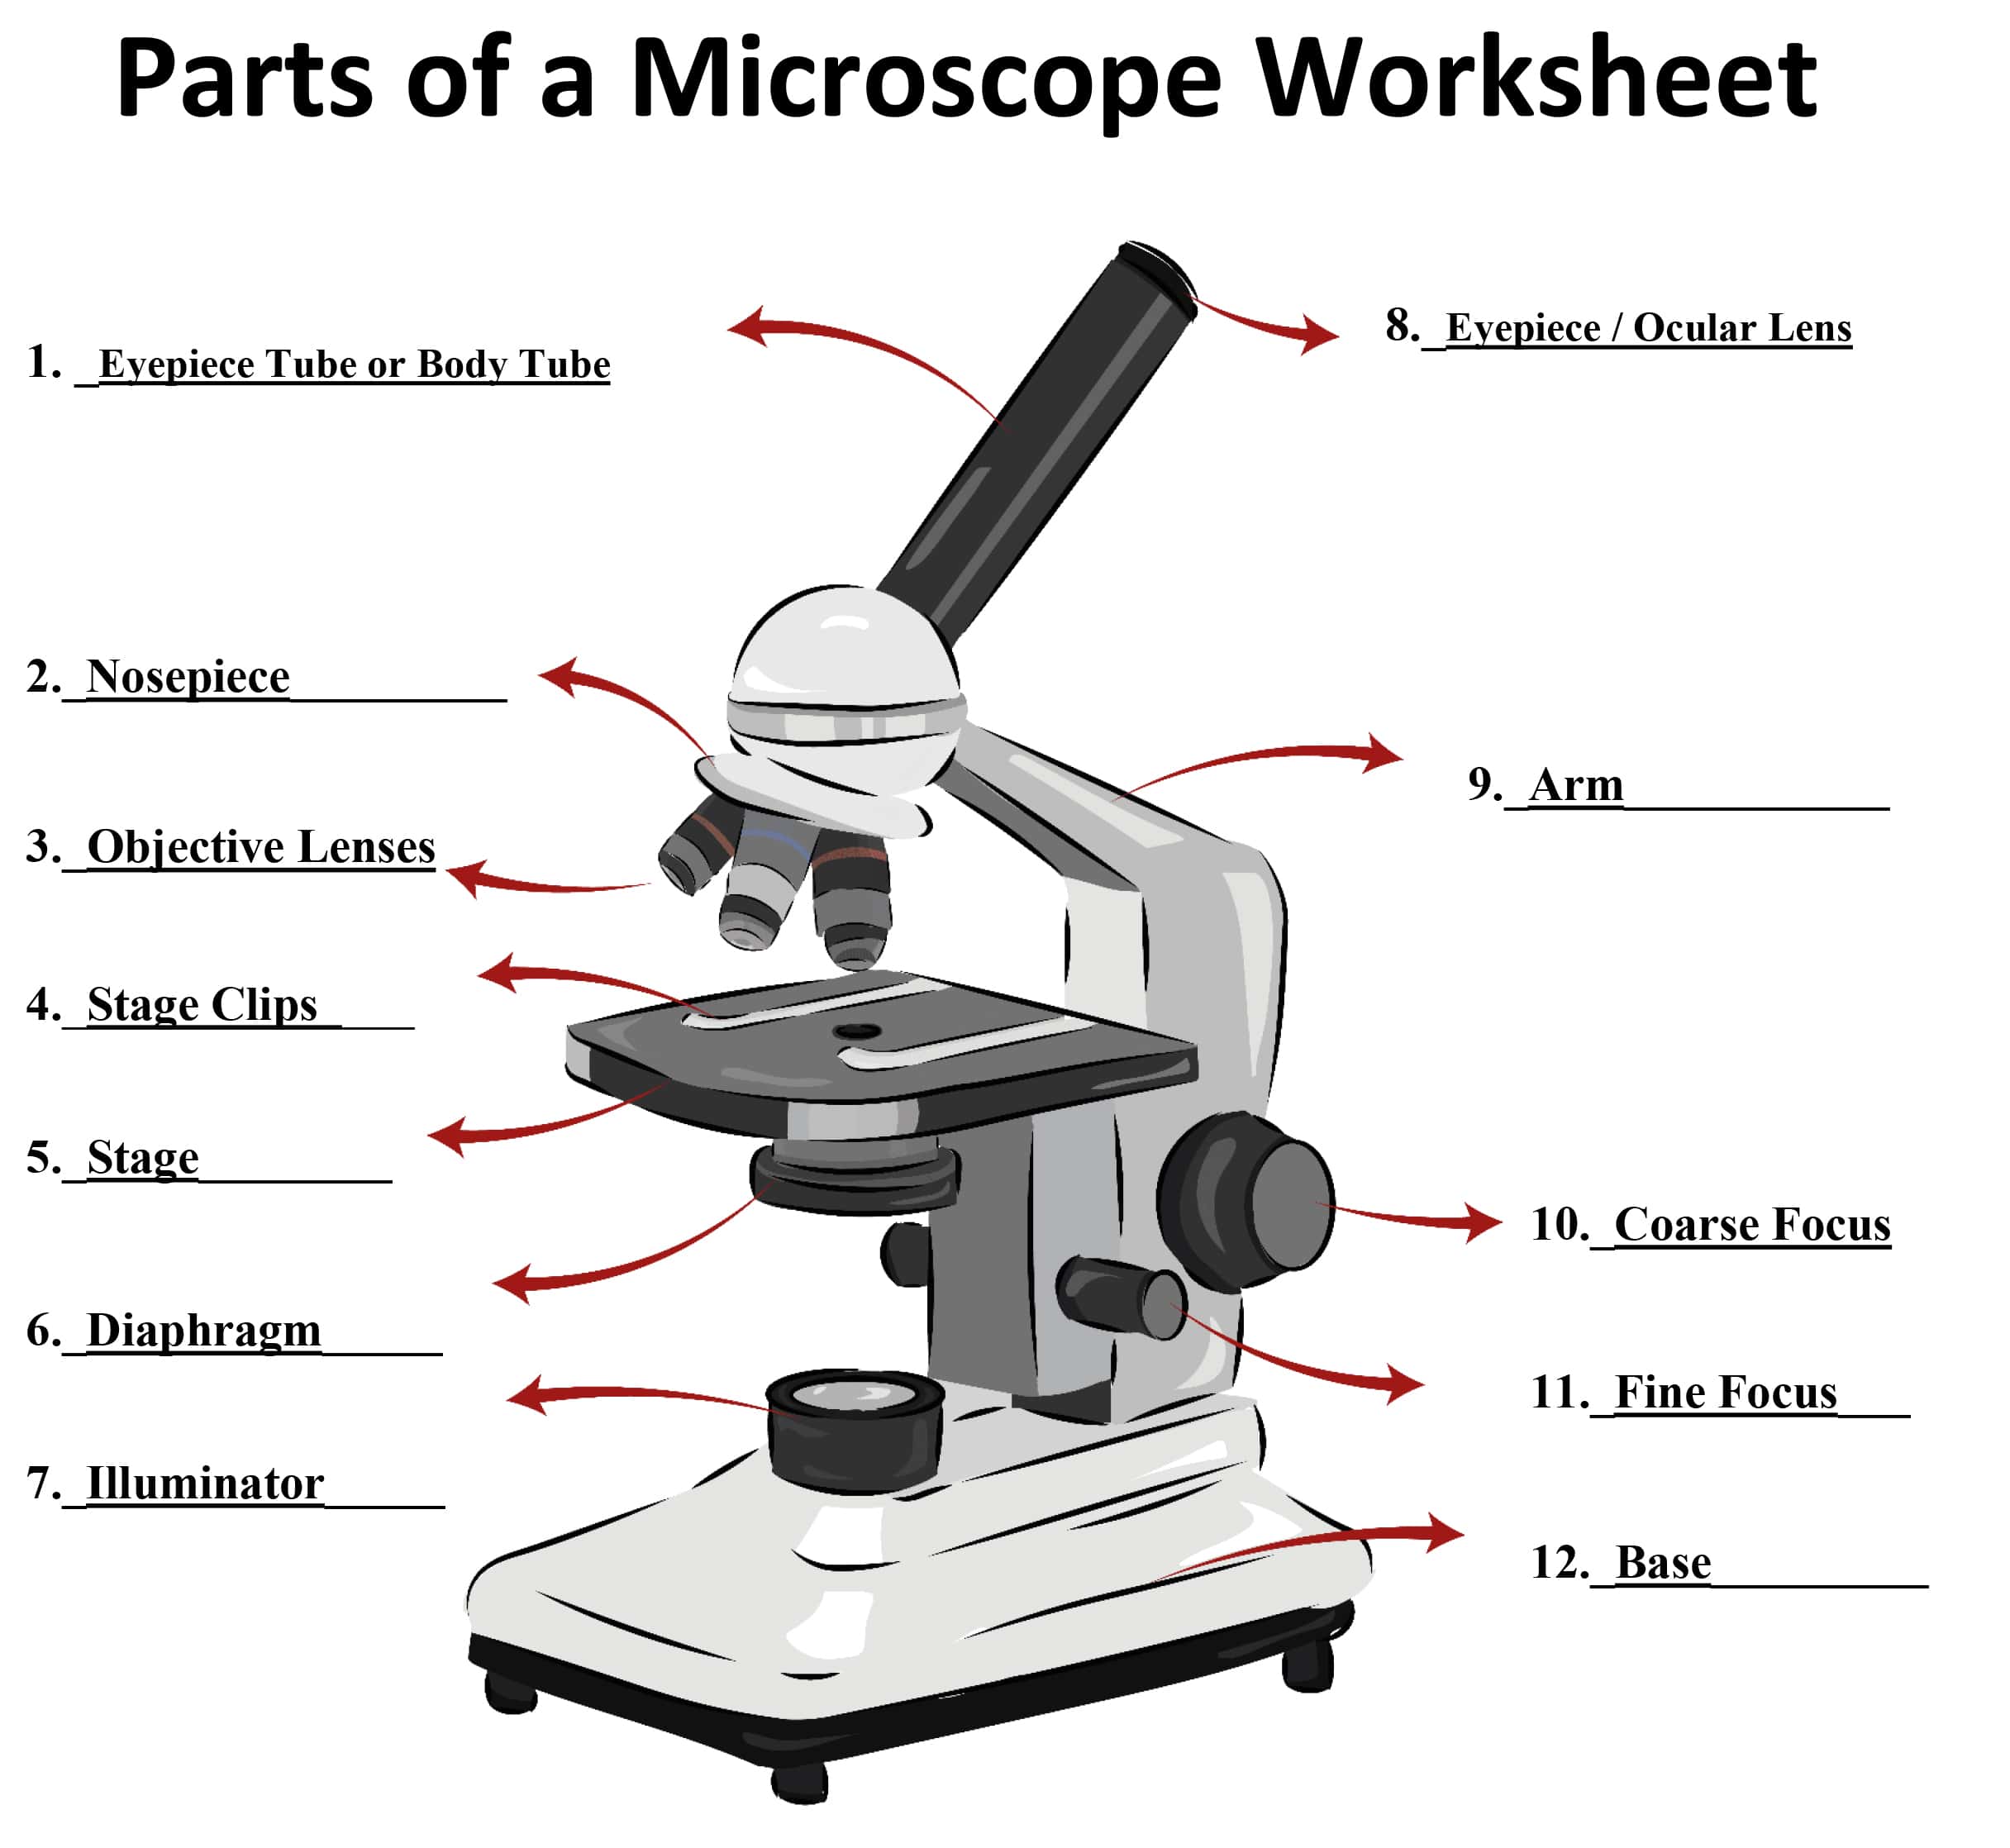
Optical microscopy is a widely used technique for observing and studying samples at the microscale using visible light. It involves the use of a microscope, which is an optical instrument that magnifies and resolves fine details of a sample. The principles of optical microscopy are based on the behaviour of light as it interacts with the sample and the components of the microscope.
Course illustration

Here are the key principles:

Illumination:

A light source provides illumination that passes through the sample.

The light can be transmitted through the sample (transmitted light microscopy) or reflected off the sample's surface (reflected light microscopy).

Lenses and Magnification:

Lenses in the microscope, including the objective and eyepiece lenses, magnify the image of the sample.

The objective lens is positioned close to the sample and collects light from it, creating a magnified real image.

The eyepiece lens further magnifies the real image formed by the objective lens, making it visible to the observer.

Resolution:

Resolution refers to the ability of the microscope to distinguish between two closely spaced points as separate entities.

The resolving power of a microscope is limited by the wavelength of light used for illumination. The shorter the wavelength, the higher the achievable resolution.

In practice, the resolution of optical microscopes is limited to around half the wavelength of visible light (approximately 200-300 nanometers).

Contrast Enhancement:

Many samples are transparent and lack sufficient contrast for clear observation. Contrast enhancement techniques are used to make details more visible.

Staining: Dyes are added to the sample to selectively color specific structures, improving contrast.

Phase Contrast: This technique exploits differences in refractive indices to enhance contrast in transparent samples.

Differential Interference Contrast (DIC): Similar to phase contrast, DIC enhances contrast by exploiting differences in refractive indices.

Focusing:

Achieving proper focus is crucial for obtaining clear images.

Coarse and fine focus knobs on the microscope enable the user to adjust the distance between the objective lens and the sample.

Brightfield and Darkfield Illumination:

Brightfield illumination is the most common technique, where the background is illuminated and the sample appears darker against a bright background.

Darkfield illumination involves lighting the sample from the side, causing the sample to appear bright against a dark background. This is useful for observing transparent or small samples.

Polarization:

Polarized light microscopy uses polarizers to control the direction of light vibrations, revealing information about sample birefringence and crystal orientation.

Fluorescence Microscopy:

Fluorescence microscopy uses fluorescent dyes that emit light of a different color after absorbing light of a specific wavelength. This allows specific structures or molecules to be labelled and observed with high sensitivity.

TOPIC

Brightfield, darkfield, and phase contrast microscopy

Brightfield, darkfield, and phase contrast microscopy

Brightfield, darkfield, and phase contrast microscopy are three different techniques used in optical microscopy to enhance the contrast and visibility of samples, especially those that are transparent or lack inherent contrast. Each technique offers a unique way to reveal different details of the sample by manipulating the way light interacts with it.

Brightfield Microscopy:

Principle: In brightfield microscopy, the sample is illuminated with a bright and uniform light source. The light passes through the sample and reaches the objective lens. The background appears illuminated, while the sample features appear darker due to differences in absorbance, refractive index, or scattering properties.

Applications: Brightfield microscopy is commonly used for observing stained biological samples and non-transparent materials. It is well-suited for general observation of cell structures, tissue sections, and other samples that absorb or scatter light.

Darkfield Microscopy:

Principle: Darkfield microscopy involves illuminating the sample with oblique or off-axis light, so that only scattered light enters the objective lens. This results in a dark background and brightly illuminated sample features. The contrast is generated by the scattering of light by sample structures.

Applications: Darkfield microscopy is particularly useful for transparent or nearly transparent samples, such as live cells, small organisms, and fine structures like bacterial flagella. It can highlight structural details that are difficult to observe using brightfield microscopy.

Phase Contrast Microscopy:

Principle: Phase contrast microscopy takes advantage of differences in refractive index within a sample. This technique transforms phase variations (changes in the speed and direction of light) caused by differences in thickness and refractive index into intensity variations, enhancing contrast.

Applications: Phase contrast microscopy is widely used in biological and medical research to observe transparent or unstained samples, such as living cells, cell organelles, and fine cell structures. It allows for the visualization of subtle details that are otherwise difficult to see in brightfield microscopy.

TOPIC

Transmission electron microscopy (TEM) and scanning electron microscopy (SEM)

Transmission electron microscopy (TEM)

Transmission Electron Microscopy (TEM) is a powerful imaging technique that uses a beam of electrons to visualize the internal structure of materials at a very high resolution. TEM allows researchers to observe details at the nanoscale and even atomic scale, providing insights into the fine structure, composition, and properties of various materials. Here are the key principles and components of TEM:

Principle: In TEM, a beam of electrons is transmitted through an ultrathin sample. As the electrons pass through the sample, they interact with its atoms, producing signals that are then used to create images and gather information about the sample's structure and properties. The high energy and short wavelength of electrons enable much higher resolution compared to visible light microscopy.

Components:

Electron Source: The electron source typically consists of a heated filament that emits electrons when heated. More advanced sources, such as field emission guns (FEG), provide a more coherent and brighter electron beam.

Electron Lenses: A series of electromagnetic lenses control the trajectory of the electron beam. These lenses focus, deflect, and magnify the electron beam as it travels through the microscope's optical column.

Sample Holder: The sample needs to be ultra-thin (typically around 100 nanometers thick) to allow electrons to pass through. The sample is placed on a thin grid, often made of copper or other materials, which supports the sample while minimizing electron scattering.

Vacuum System: TEM operates in a high-vacuum environment to prevent electron scattering by air molecules. The vacuum also ensures that the electron beam remains focused and stable.

Condenser Lens System: This system focuses the electron beam onto the sample, similar to how a lens focuses light in an optical microscope.

Objective Lens: The objective lens further focuses the electron beam after it passes through the sample. This lens is crucial for creating high-resolution images.

Projector Lenses: These lenses magnify the electron beam to form an enlarged image on a fluorescent screen or a digital camera.

Image Recording System: Modern TEMs use digital cameras to capture electron images. These images can be used to reconstruct high-resolution images of the sample's internal structure.

Types of Information Obtained:

High-Resolution Imaging: TEM can reveal the detailed morphology and crystallography of materials. It can even resolve individual atoms under certain conditions.

Selected Area Electron Diffraction (SAED): By directing the electron beam to a small area of the sample, diffraction patterns are produced, allowing researchers to determine the crystal structure and orientation of the material.

Energy Dispersive X-ray Spectroscopy (EDS or EDX): EDS is often coupled with TEM to analyze the elemental composition of the sample. When the electron beam interacts with the sample, it can excite characteristic X-rays from the atoms, providing information about the elements present.

Electron Energy Loss Spectroscopy (EELS): EELS measures the energy loss of electrons as they pass through the sample, providing information about the sample's composition, electronic structure, and bonding.

Transmission electron microscopy has revolutionized our understanding of materials at the nanoscale, contributing to advancements in materials science, nanotechnology, biology, and various other fields.

Scanning Electron Microscopy (SEM)

Scanning Electron Microscopy (SEM) is an advanced imaging technique that uses a focused beam of electrons to generate high-resolution, three-dimensional images of the surface of a sample. SEM offers insights into the topography, morphology, and composition of materials at the nanoscale. Here's an overview of the principles and components of SEM:

Principle: In SEM, a beam of electrons is scanned across the surface of a sample, and the interactions between the electrons and the sample are detected and used to create images. The primary electron beam interacts with the sample's atoms, causing various signals to be emitted. These signals, including secondary electrons, backscattered electrons, and characteristic X-rays, provide information about the sample's surface features and composition.

Components:

Electron Source: SEMs use an electron source, typically a tungsten filament or a field emission gun (FEG), to generate a beam of electrons.

Electron Optics: Electromagnetic lenses control the electron beam's trajectory, focusing it onto the sample and controlling the depth of field.

Sample Stage: The sample is placed on a stage that can be adjusted in multiple directions to position the area of interest in the beam's path.

Scanning System: The scanning system directs the focused electron beam across the sample's surface in a raster pattern. This scanning motion is synchronized with the detection of emitted signals.

Detectors: Different detectors collect various signals emitted from the sample, including secondary electrons (SE), backscattered electrons (BSE), and X-rays. These signals are used to create different types of images and gather compositional information.

Secondary Electron Detector: SE detectors capture low-energy electrons that are emitted from the sample's surface due to interactions with the primary electron beam. These electrons provide detailed topographical information, resulting in high-resolution surface images.

Backscattered Electron Detector: BSE detectors collect electrons that are backscattered from the sample's atoms due to interactions with the primary electron beam. BSE images provide information about the atomic composition and density variations of the sample's surface.

X-ray Spectrometer: An energy-dispersive X-ray spectrometer (EDS) can be attached to SEM to analyze the X-rays emitted from the sample due to interactions with the electron beam. This provides information about the elemental composition of the sample.

Types of Information Obtained:

Surface Topography: SEM produces high-resolution images that reveal the surface topography and features of the sample in great detail.

Morphology and Texture: SEM images offer insights into the shape, size, and arrangement of particles, fibers, and other structures on the sample's surface.

Elemental Composition: EDS analysis allows for the identification and quantification of elements present in the sample.

Phase Distribution: Differences in backscattered electron signals can help distinguish different phases or materials within a sample.

TOPIC

Image formation, resolution, and sample preparation

Image formation, resolution, and sample preparation

Image Formation: Image formation in both TEM and SEM involves the interaction of an electron beam with the sample. The resulting signals are detected and processed to generate images. The primary signals include secondary electrons (SE), backscattered electrons (BSE), and transmitted electrons (TEM). These signals carry information about the sample's surface topography, composition, and internal structure.

Resolution: Resolution in microscopy refers to the ability to distinguish two closely spaced objects as separate entities. It's a crucial parameter for revealing fine details in an image. The resolution of a microscope is influenced by several factors, including the wavelength (or energy) of the incident particles (electrons in this case) and the quality of the optics.

TEM Resolution: In TEM, the wavelength of electrons is much smaller than that of visible light, allowing for extremely high resolution. Theoretical resolution in TEM can be as high as sub-angstrom levels, enabling imaging of atomic arrangements within materials.

SEM Resolution: SEM resolution is lower than that of TEM due to the larger wavelength of electrons. However, SEM still provides impressive sub-nanometer resolution for surface topography and imaging of nanostructures.

Sample Preparation: Sample preparation is a critical aspect of microscopy. In both TEM and SEM, samples need to be carefully prepared to ensure optimal imaging conditions and accurate results.

TEM Sample Preparation:

Thin Sections: Samples must be ultra-thin (typically 50-100 nanometers) to allow electron transmission. Techniques like ultramicrotomy are used to cut thin sections from bulk samples.

Embedding: Biological samples are often embedded in resins to provide structural support during sectioning.

Staining: Staining with heavy metals enhances contrast in TEM images. This is particularly useful for biological samples.

Grid Mounting: Thin sections are mounted on grids with support films that are transparent to electrons.

SEM Sample Preparation:

Coating: Non-conductive samples are coated with a thin layer of conductive material (e.g., gold, platinum) to prevent charging effects.

Surface Cleaning: Samples should be clean and free from contaminants to avoid artifacts in the images.

Fixation: Biological samples are often fixed and dehydrated to preserve their structure and prevent collapse during imaging.

Mounting: Samples are typically mounted on stubs or holders that fit into the SEM stage.

Subject 1 of 5
SUBJECT 02 / 05

X-ray Diffraction and Crystallography

X-ray diffraction and crystallography are fundamental techniques used to study the structure of crystalline materials at the atomic and molecular level. These techniques provide insights into the arrangement of atoms within a crystal lattice, allowing researchers to determine the crystal's unit cell dimensions, symmetry, and spatial distribution of atoms. Here's an overview of X-ray diffraction and crystallography:

TOPIC

Basics of X-ray diffraction (XRD)

Basics of X-ray diffraction (XRD)

X-ray diffraction (XRD) is a powerful technique used to analyze the atomic and molecular structure of crystalline materials. It provides valuable information about the arrangement of atoms within a crystal lattice. Here are the basics of X-ray diffraction:

Principle: X-ray diffraction is based on the principle of constructive and destructive interference of X-rays when they interact with a crystalline lattice. When X-rays strike the crystal, they scatter in different directions due to the periodic arrangement of atoms in the lattice. The scattered X-rays interfere with each other, resulting in a diffraction pattern that can be recorded and analyzed.

Bragg's Law: Bragg's law describes the relationship between the angle of incidence (θ) of the X-rays and the spacing (d) between crystal planes that result in constructive interference:

nλ = 2d sin(θ)

Where:

n is the order of the diffraction (usually 1 for primary diffraction)

λ is the wavelength of the X-rays

d is the spacing between crystal planes

θ is the angle of incidence

Components of XRD:

X-ray Source: An X-ray source, often an X-ray tube, emits a focused beam of X-rays with a specific wavelength.

Sample Holder: The crystalline sample is mounted on a sample holder, which is rotated to change the angle of incidence.

Goniometer: A goniometer positions the sample holder and allows for precise rotation of the sample to collect diffraction data at different angles.

Detector: A detector records the intensity of the diffracted X-rays as a function of the angle of incidence.

Data Analysis:

Obtaining Diffraction Pattern: The sample is rotated, and X-ray diffraction data is collected over a range of angles.

Peak Identification: The intensities and positions of the diffraction peaks in the pattern provide information about the crystal's lattice spacing and orientation.

Peak Positions: The positions of the peaks are used to calculate the interplanar spacing (d) of the crystal lattice.

Crystal Structure Determination: By analyzing the positions and intensities of the diffraction peaks, researchers can deduce the crystal's unit cell dimensions, symmetry, and arrangement of atoms.

Applications: X-ray diffraction is used in various fields, including materials science, solid-state physics, chemistry, and biology. It's essential for determining crystal structures, identifying unknown materials, studying phase transitions, and characterizing crystal defects.

Limitations:

XRD is suitable for crystalline materials with ordered atomic arrangements.

It provides information about the average structure of a crystal and may not capture local disorder.

Amorphous or non-crystalline materials do not produce well-defined diffraction patterns.

TOPIC

Determination of crystal structures using XRD

Determination of crystal structures using XRD

Determining crystal structures using X-ray diffraction (XRD) involves analyzing the diffraction pattern obtained from a crystalline sample to deduce the arrangement of atoms within the crystal lattice. Here's a step-by-step overview of how crystal structures are determined using XRD:

1. Sample Preparation:

The crystalline sample needs to be well-prepared and of sufficient quality for accurate diffraction data.

The sample is typically ground into a fine powder to ensure a representative sample.

2. Data Collection:

The sample is mounted on a sample holder and placed in the XRD instrument.

The instrument's goniometer rotates the sample holder to collect diffraction data over a range of angles.

The diffracted X-rays are detected, and their intensities are recorded as a function of the scattering angle.

3. Peak Identification:

The diffraction pattern consists of a series of peaks, each corresponding to a specific set of crystallographic planes in the sample.

The positions (2θ angles) of these peaks provide information about the interplanar spacing (d-spacing) of the crystal lattice.

TOPIC

Bragg's law and diffraction patterns

4. Bragg's Law Calculation:

Bragg's law (nλ = 2d sin(θ)) is used to relate the diffraction angle (θ), the X-ray wavelength (λ), and the d-spacing.

By rearranging Bragg's law, the d-spacings corresponding to each peak can be calculated.

5. Indexing:

The d-spacings and their corresponding peak positions are used to index the diffraction pattern.

Indexing involves identifying a set of three d-spacings that are consistent with a specific crystal lattice and its orientation.

6. Unit Cell Parameters:

The indexed d-spacings are used to calculate the lattice parameters (a, b, c) of the unit cell. The unit cell is the smallest repeating unit of the crystal lattice.

The angles (α, β, γ) between the unit cell edges are also determined.

7. Space Group Determination:

The symmetry of the crystal lattice is determined based on the pattern of observed diffraction peaks.

The combination of lattice parameters and symmetry elements yields the space group, which describes the complete symmetry of the crystal lattice.

8. Electron Density Calculation:

The intensities of the diffraction peaks are used to calculate the electron density distribution within the unit cell.

The calculated electron density map is refined through iterations to match the observed intensities.

9. Model Building and Refinement:

A preliminary structural model is built within the electron density map.

The model is refined using methods such as least squares, and adjustments are made to match the observed diffraction data.

10. Validation:

The final refined model is validated against the observed diffraction pattern and other physical constraints.

Additional analyses, such as Rietveld refinement, may be performed for a more accurate fit.

11. Publication and Analysis:

The determined crystal structure is typically published, and its analysis provides insights into the arrangement of atoms within the crystal lattice.

The structural information can be used for understanding properties, designing materials, and contributing to scientific knowledge.

TOPIC

Powder XRD and single crystal XRD

Powder XRD and single crystal XRD

Powder X-ray diffraction (PXRD) and single crystal X-ray diffraction (SCXRD) are two variations of X-ray diffraction techniques used to determine the crystal structures of materials. They have different applications and are suited for different types of samples. Here's a comparison of these two techniques:

Powder X-ray Diffraction (PXRD): PXRD is used to analyze polycrystalline materials, where the sample consists of numerous small crystalline grains oriented in random directions. This technique is particularly useful when obtaining a single crystal is challenging or not feasible.

Applications:

Phase Identification: PXRD is commonly used to identify phases present in a mixture or to confirm the crystalline nature of a sample.

Quantitative Analysis: It can quantify the relative proportions of different phases in a mixture.

Amorphous Content: It can detect the presence of amorphous components in a sample.

Crystallography: PXRD can be used to determine crystal structures, especially if growing a single crystal is difficult.

Advantages:

Can analyze powders, films, and bulk materials.

Requires minimal sample preparation compared to SCXRD.

Provides information about phase composition and unit cell dimensions.

Useful for high-throughput analysis.

Limitations:

Low-resolution structural information due to multiple orientations of crystalline grains.

Difficulty in indexing diffraction patterns for complex or overlapping phases.

Cannot provide precise atomic positions or detailed crystallographic information.

Single Crystal X-ray Diffraction (SCXRD): SCXRD is used to determine the three-dimensional atomic arrangement within a single crystal. This technique requires growing or finding a single, well-formed crystal that is suitable for X-ray analysis.

Applications:

High-Resolution Structures: SCXRD provides high-resolution structural information, including atomic positions and bond lengths.

Molecular Conformations: Useful for determining the conformation of molecules, including organic compounds and biomolecules.

Crystal Symmetry: SCXRD reveals the symmetry elements of the crystal lattice.

Inorganic Structures: Analyzes inorganic compounds and complex metal-organic structures.

Advantages:

High-resolution structural details at the atomic level.

Accurate determination of unit cell parameters, symmetry, and atomic positions.

Provides precise information about bond lengths and angles.

Limitations:

Requires obtaining a high-quality single crystal, which can be challenging for some materials.

Sample preparation can be complex and time-consuming.

Limited to materials that can be crystallized as single crystals.

Analysis may be slower compared to PXRD.

Subject 2 of 5
SUBJECT 03 / 05

Thermal Analysis: DSC, TGA, and TMA

Thermal analysis refers to a set of techniques used to study how the physical and chemical properties of materials change as they are subjected to controlled temperature conditions.

TOPIC

Differential scanning calorimetry (DSC) and its applications

Differential scanning calorimetry (DSC) and its applications

Differential scanning calorimetry (DSC) is a thermal analysis technique that measures the heat flow associated with temperature changes or phase transitions in a sample. It provides insights into the energy changes occurring within a material as it is heated or cooled under controlled conditions.

Principle: DSC works by comparing the heat flow to or from the sample and a reference material as they are subjected to the same temperature profile. Any differences in heat flow between the sample and reference are recorded, indicating processes such as melting, crystallization, phase transitions, and reactions.

Applications: DSC has numerous applications in various fields:

Melting and Solidification: DSC can determine the melting point and heat of fusion of materials, helping to understand their thermal stability and processing conditions.

Crystallization: It can study crystallization processes, such as polymorphic transitions and recrystallization.

Glass Transition: DSC measures the glass transition temperature, which is crucial for assessing the behaviour of polymers and amorphous materials.

Reaction Kinetics: It can provide information about reaction kinetics, activation energy, and enthalpy changes associated with chemical reactions.

Purity and Composition: DSC can be used to assess the purity of a substance by detecting changes in its melting or boiling points due to impurities.

Thermal Stability: It helps evaluate the stability of materials by monitoring their weight loss and heat flow during thermal degradation.

Curing and Cross-Linking: DSC is used to analyze curing reactions in polymers, composites, and adhesives.

Pharmaceuticals: DSC is widely used in pharmaceuticals to analyze drug stability, determine the crystallinity of drugs, and study interactions between drug components.

Food Science: It assesses thermal properties of food products, including changes in texture and shelf-life.

Materials Development: DSC aids in the development of new materials with tailored properties by characterizing their thermal behavior.

Advantages:

Provides quantitative data about thermal properties and transitions.

Requires minimal sample preparation.

Non-destructive technique.

Can be used for solid, liquid, and gas samples.

Limitations:

May not provide detailed structural information about transitions.

Can be influenced by factors such as sample size, heating rate, and instrument calibration.

TOPIC

Thermo-gravimetric analysis (TGA) for studying weight changes.

Thermo-gravimetric analysis (TGA)

Thermogravimetric Analysis (TGA) is a thermal analysis technique used to study the weight changes of a material as it is subjected to controlled temperature conditions. TGA provides insights into processes such as decomposition, volatilization, oxidation, and other chemical reactions that involve changes in mass.

Principle: TGA works by continuously measuring the weight of a sample as it is heated (or cooled) at a constant rate in a controlled atmosphere. The change in weight is recorded as a function of temperature, allowing for the identification of thermal events and chemical reactions that result in weight loss or gain.

Applications: TGA has a variety of applications in different fields:

Thermal Stability: TGA can determine the thermal stability of materials by observing weight loss associated with decomposition or degradation.

Moisture and Volatile Content: It's used to determine the moisture and volatile content of substances, such as polymers, food products, and pharmaceuticals.

Desorption and Adsorption Studies: TGA can analyze adsorption and desorption of gases, liquids, and solids on surfaces or in porous materials.

Catalyst Analysis: It's employed to study catalysts' activity and stability by monitoring changes in weight during catalytic reactions.

Characterization of Polymers: TGA is used to investigate the decomposition and degradation temperatures of polymers, aiding in material selection and processing.

Analysis of Inorganic Compounds: TGA can assess the composition and thermal behavior of inorganic materials, such as minerals and ceramics.

Determination of Decomposition Kinetics: It provides information about reaction kinetics, activation energy, and reaction mechanisms.

Quality Control: TGA is utilized for quality control of raw materials and finished products to ensure consistency and purity.

Advantages:

Provides quantitative data on weight changes as a function of temperature.

Offers information about thermal stability, decomposition, and reactions.

Requires minimal sample preparation.

Non-destructive technique.

Limitations:

Does not provide detailed structural information about the nature of weight changes.

Can be influenced by factors such as heating rate, sample size, and instrument calibration.

Cannot differentiate between simultaneous overlapping reactions.

Thermomechanical analysis (TMA)

Thermomechanical Analysis (TMA) is a thermal analysis technique that measures changes in the dimension of a material as a function of temperature, time, or applied force. TMA is used to study the mechanical properties and behaviour of materials in response to temperature variations, providing insights into their thermal expansion, contraction, softening, and deformation.

Principle: TMA involves subjecting a sample to a controlled temperature program while monitoring its dimensional changes. The sample is typically placed between a reference probe and a measuring probe. As the temperature changes, the sample expands or contracts, leading to movements of the measuring probe. These movements are measured and recorded, providing information about the material's mechanical behavior.

Applications: TMA has a range of applications, particularly for understanding the mechanical properties of materials with temperature:

Coefficient of Thermal Expansion (CTE): TMA measures a material's expansion or contraction in response to temperature changes, helping determine its CTE.

Softening and Glass Transition: TMA detects changes in material stiffness and rigidity during glass transitions and softening processes.

Deformation and Creep: It studies the deformation and creep behavior of materials as they experience temperature variations.

TOPIC

Thermomechanical analysis (TMA) and its use in characterizing mechanical properties with temperature

Thermal Stability: TMA evaluates the mechanical integrity and stability of materials at elevated temperatures.

Phase Transitions: It can identify phase transitions in materials by detecting changes in mechanical behaviour.

Polymer Properties: TMA is useful for studying polymers' softening and flow behavior, aiding in material selection and processing.

Composite Characterization: TMA helps analyze the thermal expansion behaviour of composite materials and interfaces.

Advantages:

Provides quantitative data on dimensional changes as a function of temperature.

Can be used to determine CTE and mechanical behaviour.

Non-destructive technique that requires minimal sample preparation.

Limitations:

May not provide information about structural changes accompanying mechanical behaviour.

Can be influenced by factors such as sample geometry, heating rate, and instrument calibration.

Subject 3 of 5
SUBJECT 04 / 05

Spectroscopic Techniques: UV-Vis, IR, NMR

Spectroscopic techniques involve the study and analysis of interactions between electromagnetic radiation and matter, providing insights into the composition, structure, and properties of materials based on the characteristic absorption, emission, or scattering of light.

TOPIC

Ultraviolet-visible spectroscopy (UV-Vis) for electronic transitions

Ultraviolet-Visible Spectroscopy (UV-Vis):

Ultraviolet-visible spectroscopy (UV-Vis) is a spectroscopic technique used to analyze the electronic transitions of molecules in the ultraviolet and visible regions of the electromagnetic spectrum. It provides information about the energy levels and electronic structure of materials by measuring their absorption or transmission of light.

Principle: UV-Vis spectroscopy is based on the principle that molecules absorb specific wavelengths of light when their electrons undergo transitions between energy levels. The absorbed energy promotes electrons from lower energy levels (ground state) to higher energy levels (excited state).

Instrumentation: A UV-Vis spectrophotometer consists of a light source that emits UV and visible light, a sample holder, and a detector. The sample is exposed to the light beam, and the detector measures the intensity of transmitted or absorbed light.

Applications:

Quantitative Analysis: UV-Vis is widely used for quantitative analysis of substances, including quantifying the concentration of analytes in solutions based on their absorption characteristics.

Qualitative Analysis: It aids in identifying chemical compounds based on their unique absorption spectra.

Color Measurement: UV-Vis spectroscopy is employed in colorimetry to quantify the color of materials based on their absorbance or transmittance properties.

Protein and Nucleic Acid Analysis: UV-Vis helps in studying biomolecules like proteins and nucleic acids by detecting their characteristic absorption bands.

Chemical Reaction Monitoring: It can track the progress of chemical reactions by monitoring changes in absorbance over time.

Environmental Analysis: UV-Vis is used for water quality assessment, monitoring pollutants, and detecting environmental contaminants.

Pharmaceutical Analysis: It is employed in drug development and quality control to analyze drug compounds and their interactions.

Food and Beverage Analysis: UV-Vis is utilized for assessing food quality, analyzing colorants, and detecting additives.

Advantages:

Rapid and non-destructive technique.

Requires minimal sample preparation.

Widely applicable in various fields.

Limitations:

May not provide detailed structural information about molecules.

Limited to molecules with electronic transitions in the UV-Vis region.

Sensitivity can be influenced by solvent effects and impurities.

TOPIC

Infrared spectroscopy (IR) and molecular vibrations

Infrared Spectroscopy (IR):

Infrared spectroscopy (IR) is a technique used to analyze the vibrational modes of molecules by studying their absorption of infrared light. It provides information about the types of chemical bonds present in a sample and the functional groups within molecules.

Principle: IR spectroscopy is based on the principle that molecules absorb specific frequencies of infrared light that correspond to the energy of their vibrational modes. As molecules vibrate, their bonds stretch, bend, or deform, leading to changes in dipole moments and resulting in absorption of IR radiation.

Instrumentation: An IR spectrometer consists of a source of infrared radiation, a sample holder, and a detector. The sample is exposed to the IR beam, and the detector measures the intensity of transmitted or absorbed light as a function of wavelength.

Molecular Vibrations: Molecules have different types of vibrational modes:

Stretching Vibrations: Bonds between atoms stretch or compress, leading to stretching vibrations. These are symmetric (vibrating in phase) or asymmetric (vibrating out of phase).

Bending Vibrations: Atoms within a molecule bend, resulting in bending vibrations.

Torsional Vibrations: Certain molecules with rotating groups exhibit torsional vibrations.

Rocking, Wagging, and Twisting Vibrations: These involve more complex molecular motions.

Applications:

Functional Group Analysis: IR spectroscopy is used to identify functional groups in molecules, aiding in compound characterization and identification.

Quantitative Analysis: It's employed for quantitative analysis, including determining concentrations of specific compounds.

Structure Elucidation: IR helps elucidate molecular structures by providing information about bond types and connectivity.

Polymer Analysis: IR is used for studying polymers, including identifying monomers and analyzing polymerization processes.

Pharmaceuticals: It's employed in drug development for analyzing drug compounds and their interactions.

Environmental Analysis: IR is used in environmental monitoring to detect pollutants and contaminants.

Forensic Science: IR spectroscopy aids in analyzing unknown substances in forensic investigations.

Advantages:

Rapid and non-destructive technique.

Provides information about functional groups and molecular vibrations.

Requires minimal sample preparation.

Limitations:

Cannot differentiate between structural isomers.

Some molecules may have weak or no IR-absorbing bands.

Intensity of absorption can be influenced by sample characteristics.

TOPIC

Nuclear magnetic resonance (NMR) and its role in structure determination

Nuclear Magnetic Resonance (NMR):

Nuclear Magnetic Resonance (NMR) is a powerful spectroscopic technique that provides detailed information about the atomic-level structure and dynamics of molecules. It exploits the magnetic properties of certain atomic nuclei to reveal insights into molecular composition, connectivity, and interactions.

Principle: NMR is based on the behaviour of atomic nuclei in a magnetic field. When placed in a strong magnetic field and subjected to radiofrequency (RF) pulses, certain atomic nuclei absorb and emit RF energy at characteristic frequencies. This absorption and emission are influenced by the local chemical environment and neighbouring nuclei, yielding valuable structural information.

Instrumentation: An NMR spectrometer consists of a magnet that generates a strong magnetic field, a sample holder containing the substance of interest, RF coils for excitation and detection, and a computer for data analysis.

Role in Structure Determination: NMR plays a crucial role in determining the structure of complex molecules, particularly organic compounds and biomolecules like proteins and nucleic acids.

Chemical Shift: The resonance frequencies of nuclei are influenced by the electron density around them. The chemical shift in NMR provides information about the chemical environment and neighbouring atoms, aiding in identifying functional groups and connectivity.

Spin-Spin Coupling: Coupling between nuclei (J-coupling) reveals the number of neighboring nuclei and their relative positions, helping establish molecular connectivity and confirming structural hypotheses.

NOE (Nuclear Over Hauser Effect): NOE measurements provide information about distances between nuclei, assisting in determining the spatial arrangement of atoms.

2D and 3D NMR: Advanced NMR techniques, such as 2D and 3D NMR spectroscopy, allow the determination of complex molecular structures by resolving overlapping signals and providing detailed connectivity information.

Protein and Biomolecular Structure: NMR is widely used in structural biology to determine the three-dimensional structures of proteins, nucleic acids, and other biomolecules in solution.

Molecular Dynamics: NMR can provide insights into the motion and dynamics of molecules over time.

Applications:

Compound Identification: NMR is used to identify unknown compounds by comparing their NMR spectra to reference spectra.

Structure Elucidation: NMR is invaluable for determining the structures of complex organic molecules, natural products, and biomolecules.

Drug Development: NMR aids in drug discovery and development by characterizing interactions between molecules and drug targets.

Quality Control: NMR is used for quality control of pharmaceuticals and other products, ensuring their chemical composition.

Advantages:

Provides atomic-level structural information.

Non-destructive technique.

Provides insights into molecular dynamics.

Limitations:

Requires a relatively large amount of sample.

Some molecules may not yield good NMR spectra.

Data analysis can be complex, especially for large biomolecules.

Subject 4 of 5
SUBJECT 05 / 05

Surface Analysis Techniques: SEM, AFM, XPS

Surface analysis techniques refer to a set of methods used to investigate the composition, structure, and properties of a material's surface. These techniques provide insights into surface chemistry, topography, and interactions, contributing to our understanding of material behavior, adhesion, catalysis, corrosion, and other surface-related phenomena.

TOPIC

Scanning electron microscopy (SEM) for surface imaging

Scanning Electron Microscopy (SEM) for Surface Imaging:

Scanning Electron Microscopy (SEM) is an advanced microscopy technique that produces high-resolution images of the surface of materials using electron beams. It allows for detailed visualization of surface features, topography, and microstructures at magnifications far beyond the capabilities of optical microscopes.

Principle: In SEM, a focused electron beam is scanned over the sample's surface. As the electron beam interacts with the sample, various signals are emitted, including secondary electrons (SE) and backscattered electrons (BSE). These signals provide information about the sample's surface morphology and composition.

Instrumentation: An SEM consists of an electron source, electron lenses, a sample chamber, detectors, and a computer for image processing and analysis. The electron beam scans the sample's surface in a raster pattern, and the emitted signals are collected to create images.

Surface Imaging: SEM is particularly effective for surface imaging due to its high resolution. It can reveal fine surface structures, textures, and features that are not easily observable with other techniques. SEM images can provide information about the shape, size, distribution, and arrangement of particles, crystals, fibers, and surface irregularities.

Applications:

Materials Science: SEM is used to analyze the surface morphology of materials, including metals, ceramics, polymers, composites, and coatings.

Geology: SEM is employed to study mineral and rock surfaces, sediment particles, and geological formations.

Biology: It aids in imaging biological specimens such as cells, tissues, and microorganisms.

Nanotechnology: SEM is used to visualize nanoparticles, nanomaterials, and nanostructures.

Electronics: SEM assists in examining microelectronic devices, integrated circuits, and semiconductor surfaces.

Forensics: It aids in analyzing trace evidence, gunshot residues, and forensic samples.

Archaeology: SEM is used for analyzing ancient artifacts, pottery, and materials from archaeological sites.

Advantages:

Provides high-resolution imaging of surface features.

Offers insights into surface morphology and microstructures.

Can analyze conductive and non-conductive samples.

Allows for three-dimensional surface reconstruction.

Limitations:

Samples must be vacuum-compatible or coated for imaging.

Imaging may damage delicate or sensitive samples.

Limited depth of field compared to optical microscopy.

TOPIC

Atomic force microscopy (AFM) and its high-resolution imaging capabilities

Atomic Force Microscopy (AFM) and its High-Resolution Imaging Capabilities:

Atomic Force Microscopy (AFM) is an advanced imaging technique that provides high-resolution, three-dimensional images of surfaces at the nanoscale. AFM operates by scanning a sharp probe tip over a sample's surface, detecting interactions between the tip and the sample's atoms or molecules. It offers exceptional imaging capabilities, revealing surface features and structures with remarkable detail.

Principle: AFM uses a small cantilever with a sharp probe tip at its end. The probe tip is brought close to the sample's surface, and interactions between the tip and the sample lead to deflection of the cantilever. This deflection is used to generate an image of the surface topography.

Instrumentation: An AFM setup consists of a sample stage, a piezoelectric scanner for precise probe positioning, a laser and detector for monitoring cantilever deflection, and a computer for data acquisition and image processing.

High-Resolution Imaging: AFM offers high-resolution imaging capabilities that allow the visualization of individual atoms, molecules, and nanostructures. It can produce images with sub-nanometer lateral resolution and atomic-scale vertical resolution, providing insights into surface roughness, morphology, and even atomic arrangements.

Applications:

Nanomaterials: AFM is used to characterize nanoparticles, nanotubes, nanowires, and other nanomaterials.

Biology: It enables imaging of biological samples, including cells, proteins, DNA, and biomolecular structures.

Materials Science: AFM is used to study thin films, coatings, polymers, and material surfaces.

Surface Roughness: It quantifies surface roughness and texture at the nanoscale.

Nanomanipulation: AFM can manipulate and position individual atoms and molecules.

Electronics: It aids in the analysis of semiconductor surfaces and device structures.

Advantages:

Provides high-resolution imaging at the nanoscale.

Non-destructive technique.

Can operate in various environments (e.g., air, liquid, vacuum).

Allows for imaging in 3D, providing depth information.

Limitations:

Imaging speed can be relatively slow.

Requires careful probe handling and calibration.

Imaging can be affected by environmental factors and sample properties.

TOPIC

X-ray photoelectron spectroscopy (XPS) for surface composition analysis

X-ray Photoelectron Spectroscopy (XPS) for Surface Composition Analysis:

X-ray Photoelectron Spectroscopy (XPS), also known as Electron Spectroscopy for Chemical Analysis (ESCA), is a surface analysis technique used to determine the elemental composition of the outermost layers of a material. XPS provides information about the types of elements present and their chemical states, helping to understand surface chemistry and interactions.

Principle: XPS involves irradiating a sample with X-rays, which cause the emission of photoelectrons from the sample's surface. The kinetic energy and number of emitted photoelectrons are measured. The binding energy of these photoelectrons is characteristic of the element and its chemical state, allowing identification and quantification.

Instrumentation: An XPS instrument consists of an X-ray source, an electron energy analyzer, a sample stage, and a vacuum system to prevent air interactions.

Surface Composition Analysis: XPS is highly effective for surface composition analysis due to its ability to detect elements from hydrogen (H) to uranium (U). It provides quantitative information about the elemental composition of the top few nanometers of a sample's surface.

Applications:

Materials Characterization: XPS is used to analyze the elemental composition of materials, such as metals, polymers, ceramics, and semiconductors.

Catalysis: It provides insights into the composition and chemical state of catalyst surfaces.

Thin Films: XPS analyzes thin films, coatings, and layers in semiconductor and electronic devices.

Surface Contamination: It detects surface contaminants, adsorbed species, and layers of oxidation.

Surface Functionalization: XPS helps analyze surface modifications and functionalizations.

Chemical State Analysis: It reveals the oxidation state and chemical environment of elements.

Advantages:

Provides quantitative elemental composition analysis.

Identifies chemical states and oxidation states of elements.

Non-destructive technique that requires minimal sample preparation.

Detects surface contaminants and adsorbed species.

Limitations:

Limited depth of analysis (a few nanometers).

Requires a vacuum environment, which may affect some samples.

Analysis area may affect results due to surface heterogeneity.

In summary, X-ray photoelectron spectroscopy is a powerful technique for surface composition analysis. It aids in understanding the chemical makeup of the outermost layers of materials, providing critical information for materials science, catalysis, electronics, and other fields where surface properties play a crucial role.

Subject 5 of 5